You set up approval workflows in Confluence. Pages go through review. Approvers sign off. Everything looks fine — until it does not.
A policy document sits “In Approval” for three weeks. Nobody notices. A workflow that used to take two days now takes ten. Content owners start bypassing the process because it is too slow. Compliance asks for evidence that your governance process is working, and you have no data to show them.
The problem is not the workflow. The problem is that nobody is watching the workflow. Approval health — the ongoing performance of your review and sign-off processes — is something most teams never measure until something breaks.
This post covers what to track, how to read the signals, and what to do when the numbers tell you something is wrong.
What Is Approval Health?
Approval health is a measure of how well your content governance workflows are functioning over time. A healthy approval process has these characteristics:
- Pages move through review predictably. Submission to approval takes a consistent number of days, not random stretches of weeks.
- Approvers respond within expected timeframes. Review requests do not sit unacknowledged indefinitely.
- Rejections lead to improvement, not frustration. When content is sent back, authors know what to fix and resubmit quickly.
- The process scales. Adding more content or more workflows does not cause the whole system to slow down.
An unhealthy process shows the opposite: unpredictable cycle times, growing queues, rising rejection rates with no improvement in submission quality, and teams avoiding the workflow entirely.
Approval health signals and actions. Warning signals should trigger specific operational responses — not panic, but targeted investigation.
The Metrics That Matter
Not everything you can measure is worth measuring. These are the metrics that actually tell you whether your approval process is working.
1. Approval Cycle Time
What it measures: The elapsed time from when a page is submitted for approval to when it receives a final decision (approved or rejected).
Why it matters: Cycle time is the single best indicator of process health. If your SOPs take 2 days to get approved and that number starts climbing to 5, then 10, something has changed — an approver is overloaded, requirements shifted, or the workflow design no longer fits the content.
What to look for:
- Average cycle time per workflow. Compare workflows against each other. If your HR Policy workflow consistently takes 5x longer than your Engineering Docs workflow, investigate why.
- Cycle time trends. A gradual increase over weeks or months signals a systemic problem, not a one-off delay.
- Outliers. Individual pages stuck in review for far longer than average often point to specific approver bottlenecks or ambiguous content that nobody wants to own.
2. Queue Depth
What it measures: The number of pages currently in an active approval state (submitted but not yet approved or rejected) at any given point.
Why it matters: A growing queue means approvals are coming in faster than they are being processed. Left unchecked, queue growth leads to longer cycle times, frustrated content owners, and eventually process abandonment.
What to look for:
- Trend direction. A stable queue is healthy. A growing queue is a warning. A shrinking queue after a process change confirms the fix worked.
- Queue composition. Are the pending items concentrated in one workflow or spread across many? Concentrated queues point to a specific bottleneck. Distributed queues suggest a systemic capacity problem.
3. Rejection and Resubmission Rate
What it measures: The percentage of submissions that are rejected at least once before eventually being approved.
Why it matters: Some rejections are healthy — they mean the review process is catching problems. But a high rejection rate (above 30-40%) often indicates that authors do not understand the approval criteria, or that the criteria are inconsistent across approvers.
What to look for:
- Rejection rate by workflow. A workflow with a 60% rejection rate is not working as designed. Either the submission guidance is unclear or the approval criteria are too subjective.
- Resubmission success rate. When authors resubmit after rejection, how often does the second attempt succeed? If resubmissions also get rejected frequently, the feedback loop is broken.
- Rejection reasons. If your tooling captures reviewer comments (ApprovalFlow does), analyze the reasons. Repeated rejections for the same type of issue — formatting, missing sections, incorrect terminology — are training problems, not workflow problems.
4. Approver Response Time
What it measures: How long individual approvers take to act on items assigned to them.
Why it matters: A single slow approver in a sequential workflow blocks every page that reaches their step. Identifying response time patterns per approver helps you rebalance workload before it becomes a bottleneck.
What to look for:
- Response time by approver. Are certain approvers consistently slower? They may be overcommitted across too many workflows.
- Response time by day of week. Some teams see approvals stall on specific days (end of sprint, month-end close). Knowing the pattern lets you plan around it.
- Step-level response time. In multi-step workflows, which step takes the longest? That step is your constraint.
5. Workflow Completion Rate
What it measures: The percentage of submitted pages that eventually reach a final “Approved” state, versus those that are abandoned, cancelled, or left indefinitely in review.
Why it matters: If 20% of submissions never complete the workflow, you have a leakage problem. Content is being created and submitted but never formally approved — which means it is either published without approval (a compliance risk) or abandoned (wasted effort).
How to Track These Metrics in Confluence
Confluence does not provide approval analytics natively. If you are using ApprovalFlow for Confluence, the Workflow Analytics dashboard gives you access to approval data at the space and workflow level.
Using the Workflow Analytics Dashboard
The analytics dashboard in ApprovalFlow shows:
- Submission and approval counts over a configurable date range
- Status distribution across your workflows (how many pages are in Draft, In Approval, Approved, Changes Requested)
- Per-workflow breakdowns so you can compare performance across different approval processes
To access analytics, navigate to the ApprovalFlow section in your Confluence space settings and select the Analytics tab. You can filter by date range and workflow to focus on the data most relevant to your review.
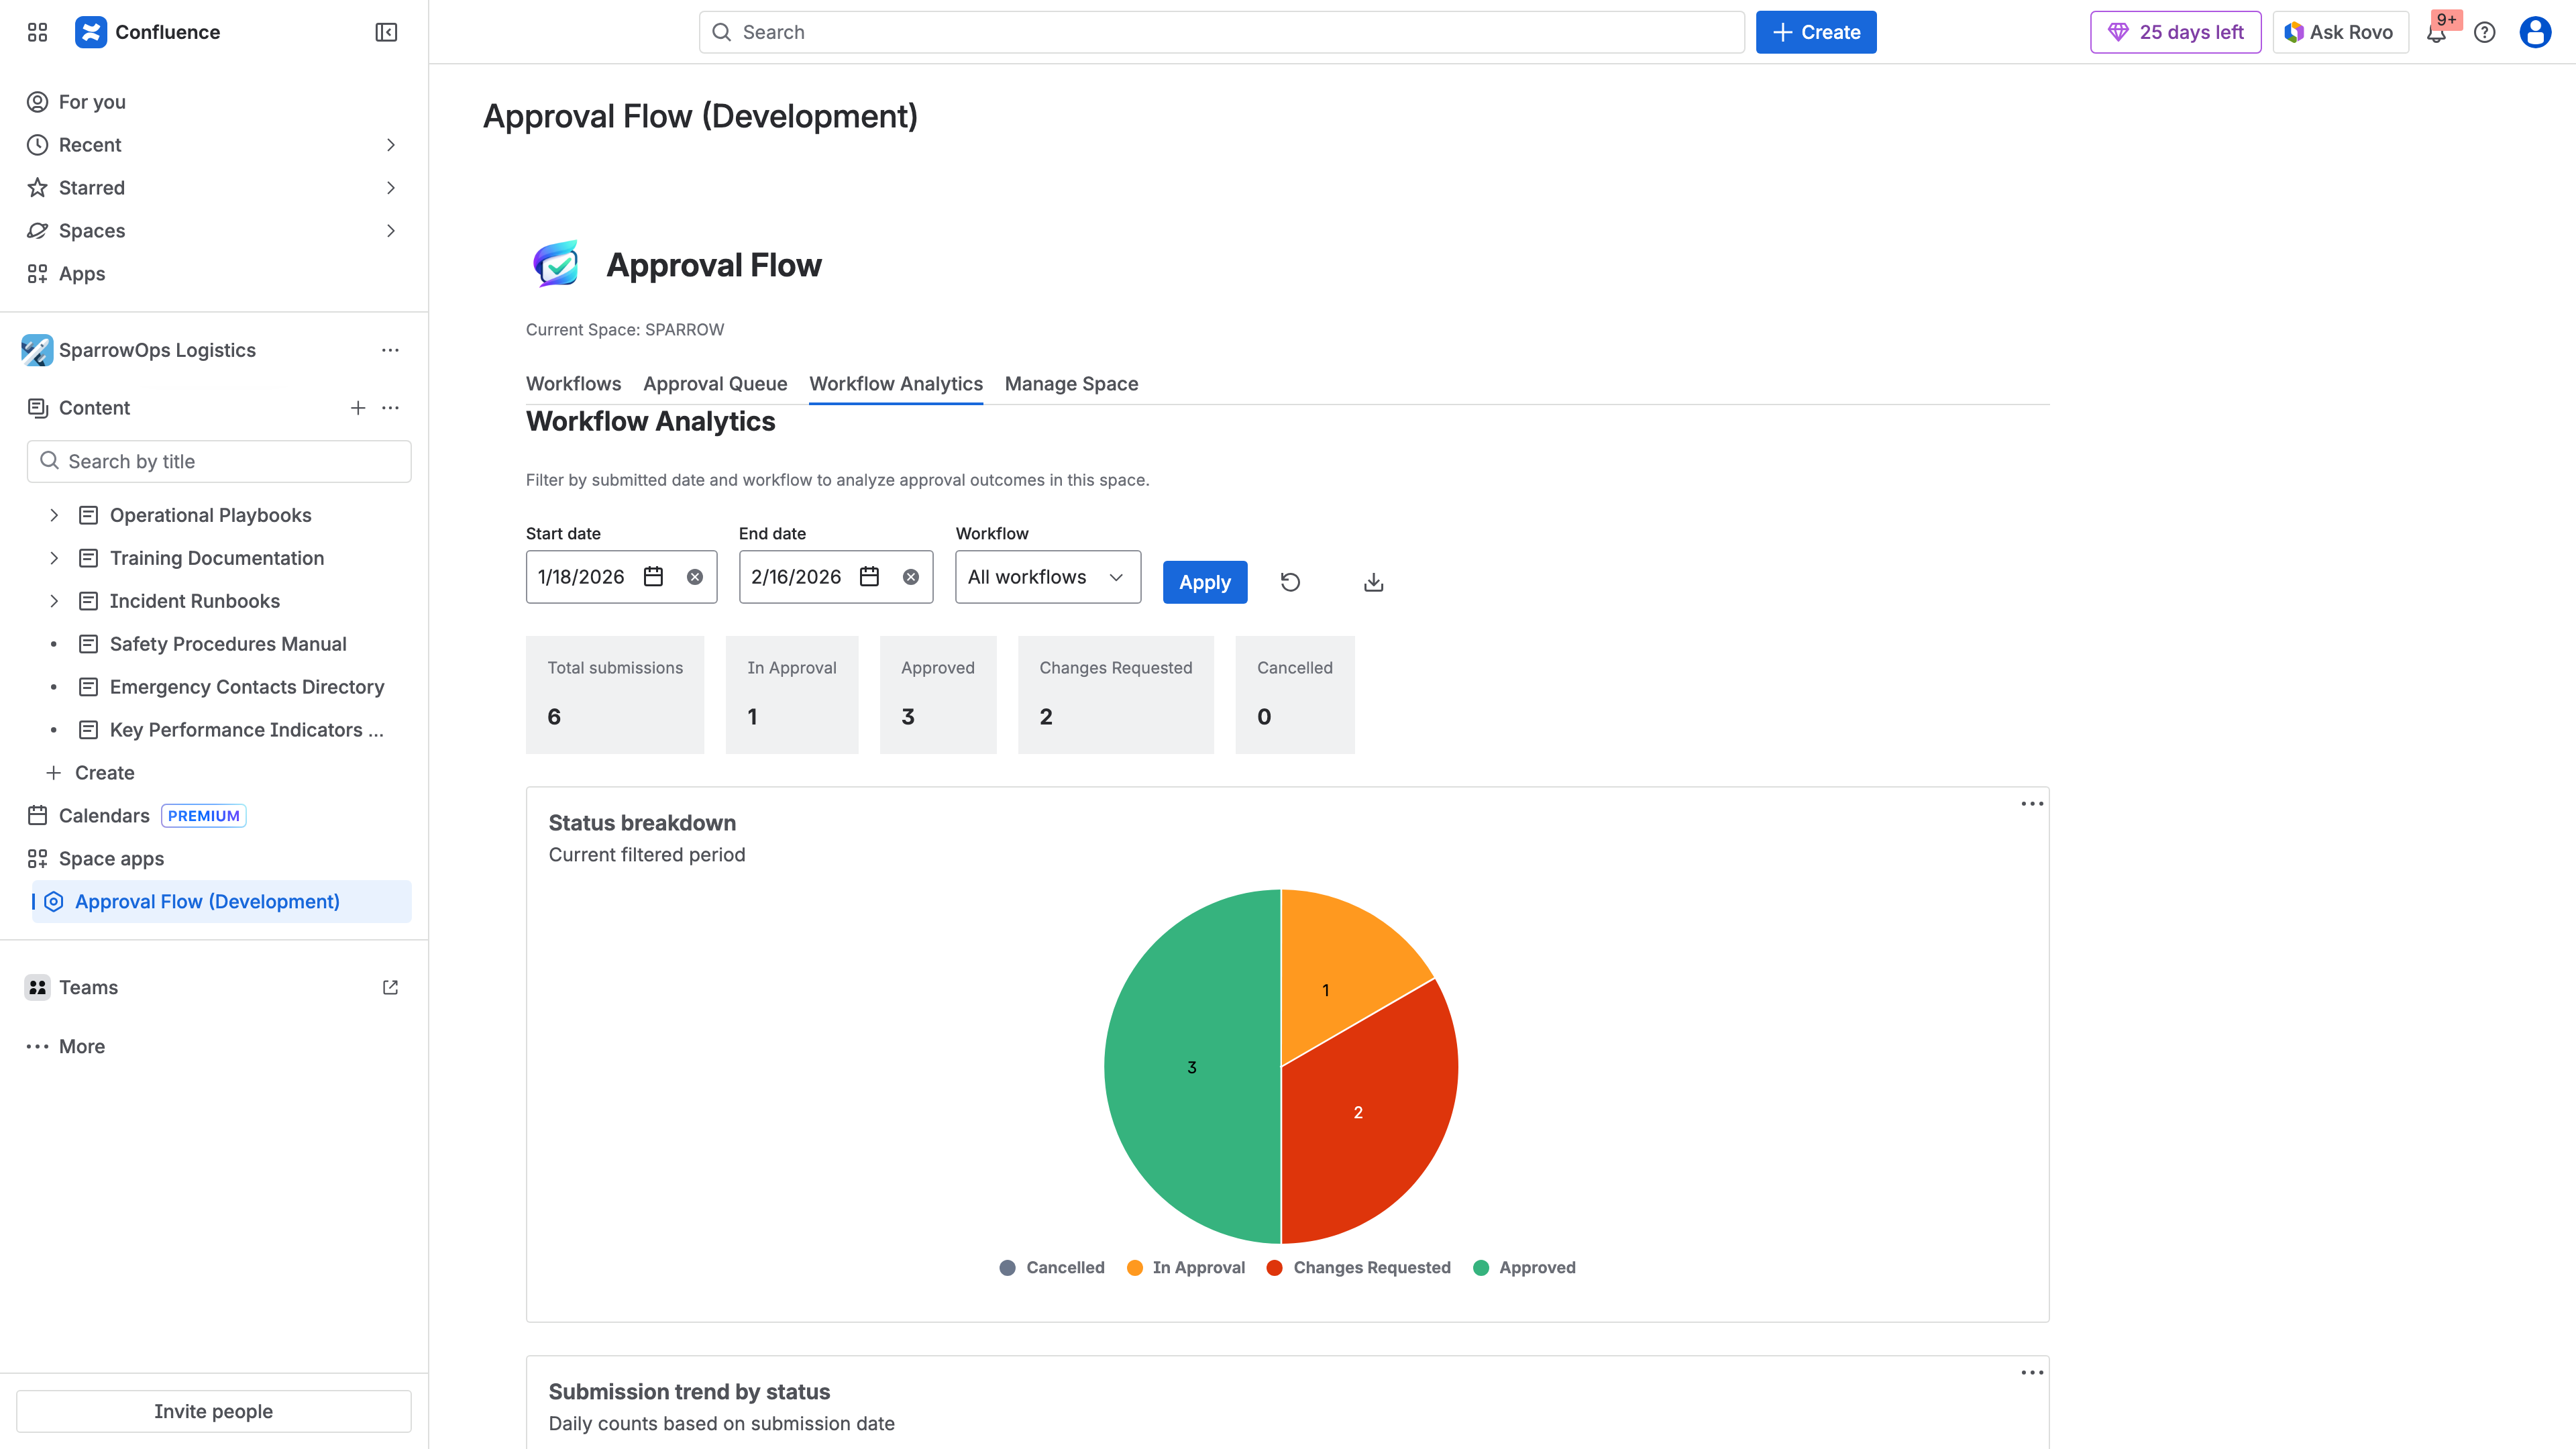
The ApprovalFlow Workflow Analytics dashboard — filter by date range and workflow to track submission volumes, status distributions, and approval trends over time.
Exporting Data for Deeper Analysis
For metrics that require calculation beyond what the dashboard shows (cycle time trends, per-approver response times), export your approval history:
- Open the Workflow Analytics dashboard in ApprovalFlow
- Select the date range and workflow you want to analyze
- Export as CSV for spreadsheet analysis or HTML for formatted reports
The export includes timestamps, actor identifiers, page version numbers, and decision comments — everything you need to calculate cycle times, build approver leaderboards, and identify patterns.
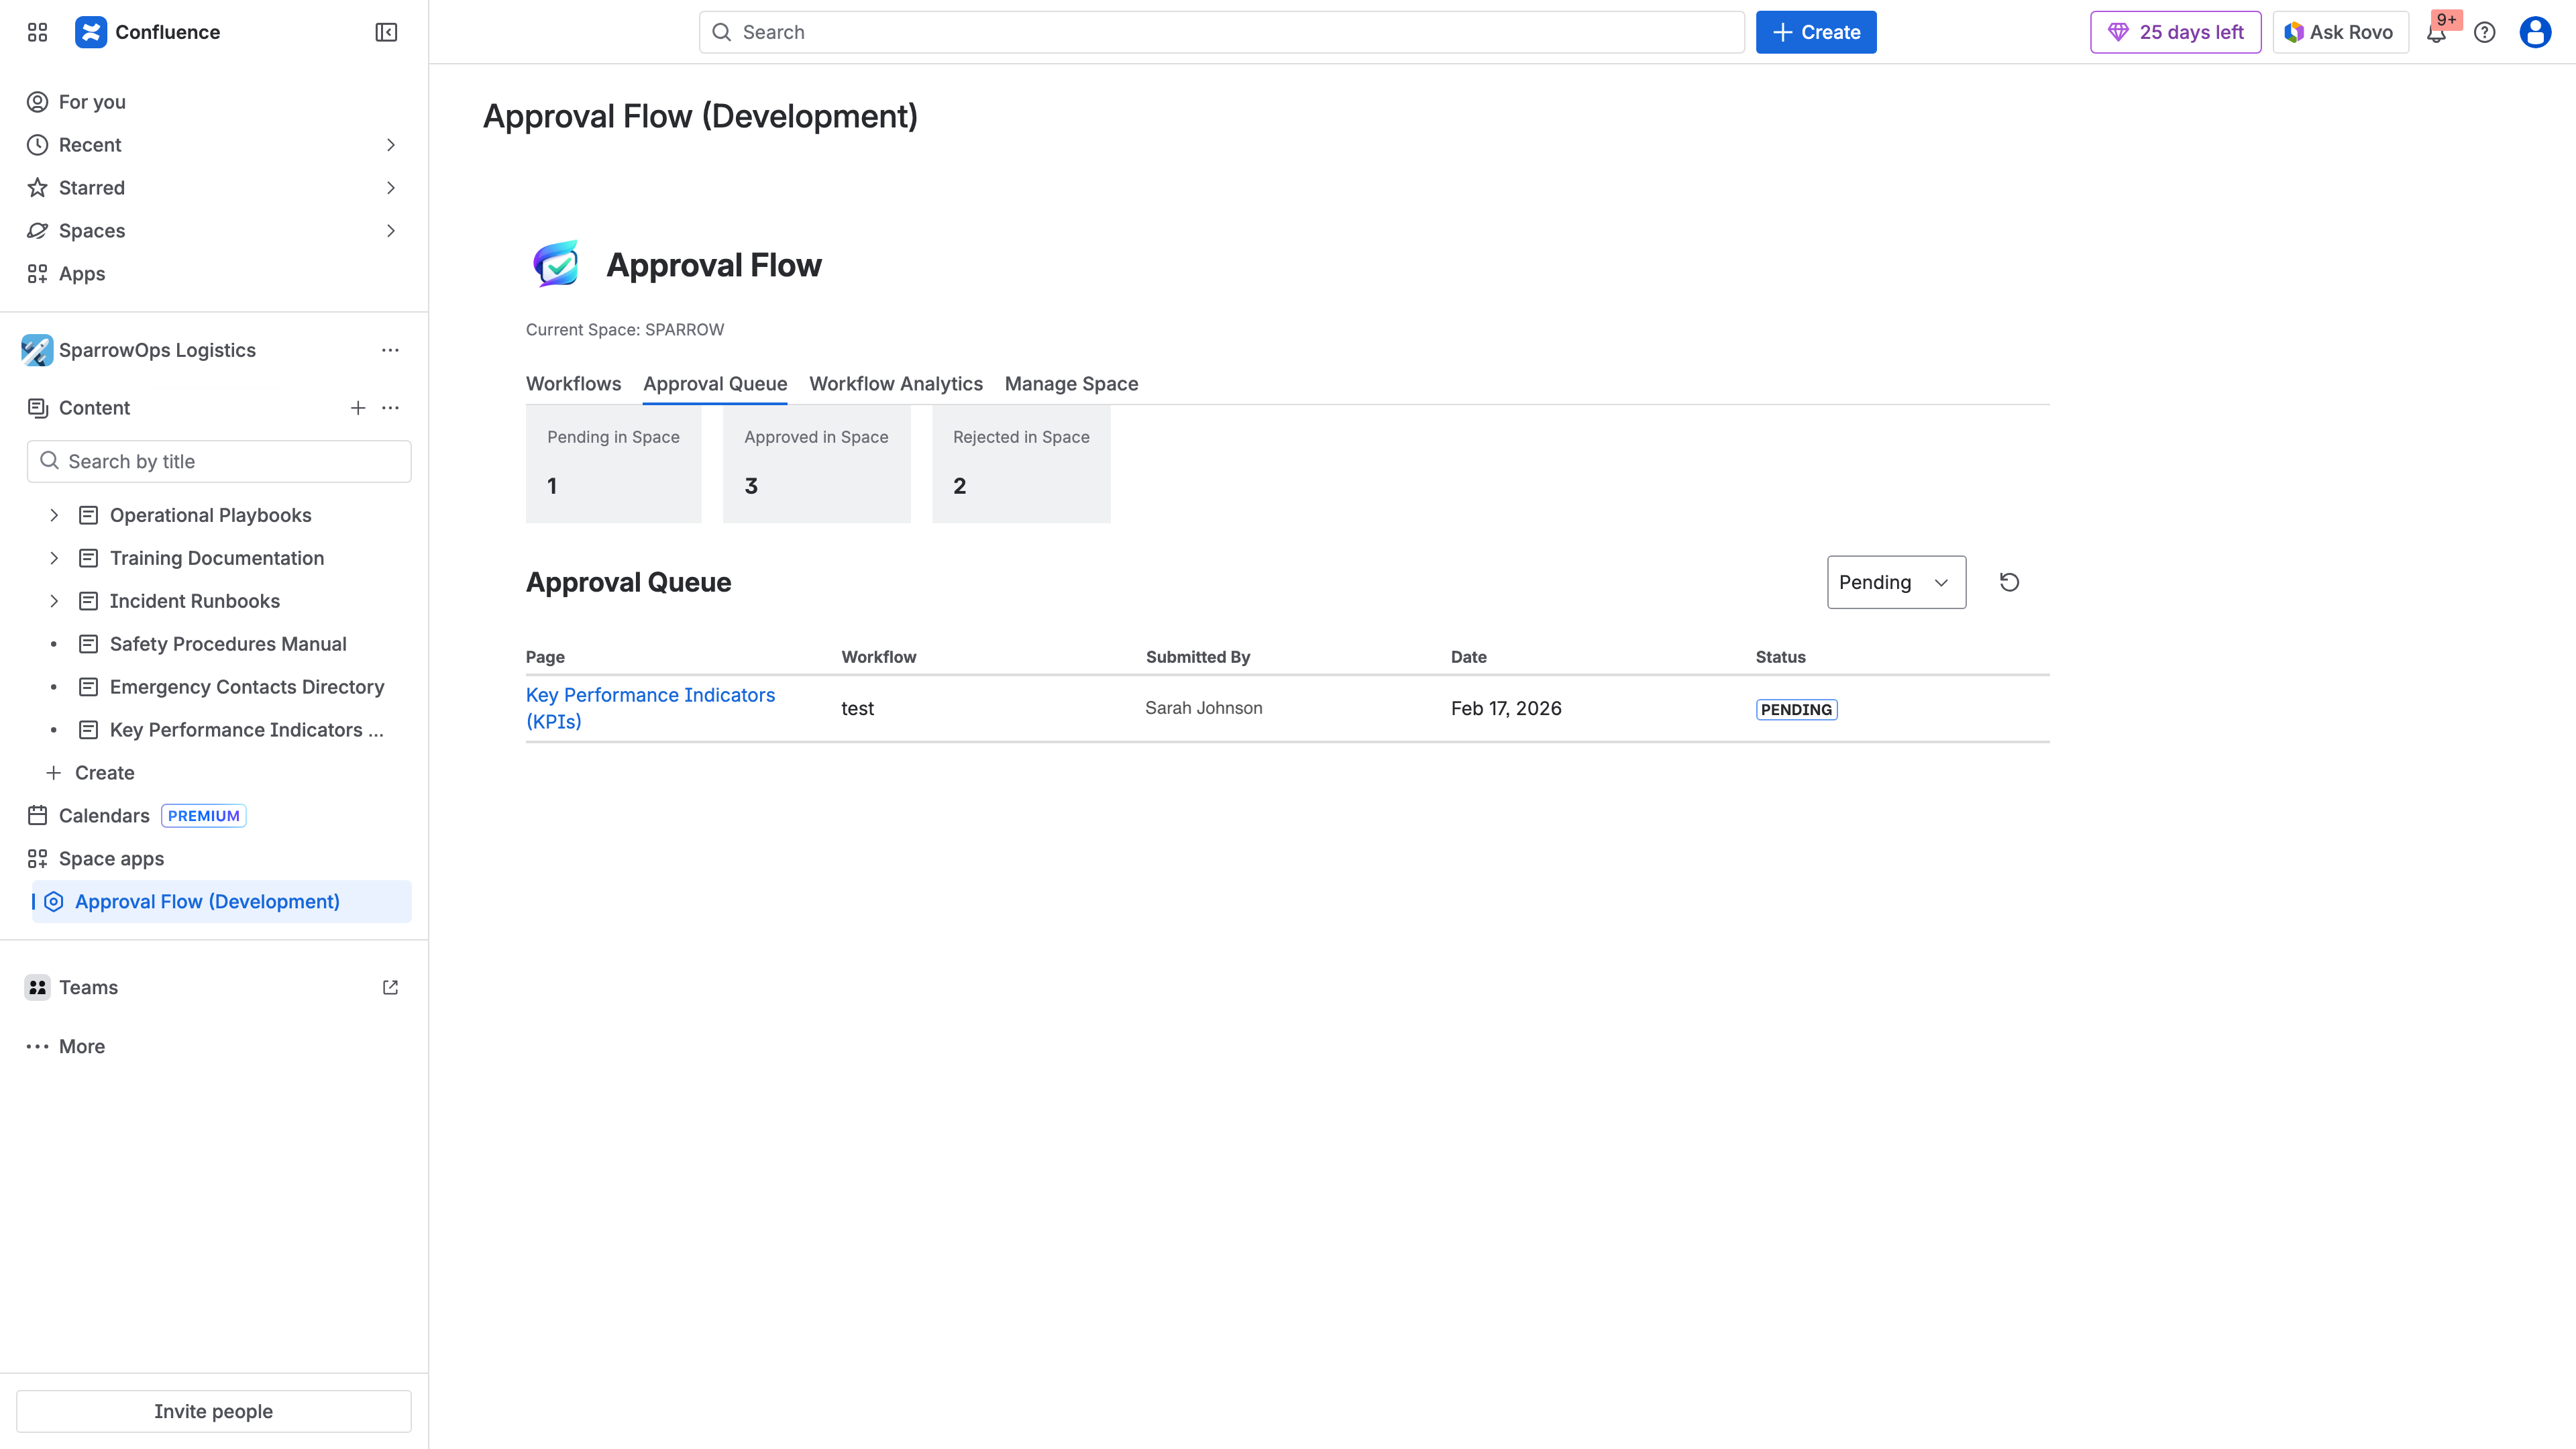
The approval queue provides real-time visibility into what is pending, approved, or rejected — essential for monitoring queue depth and identifying stuck items.
Building a Review Cadence
Raw data is only useful if someone looks at it regularly. Build analytics review into your governance cadence:
- Weekly: Glance at queue depth and flag anything stuck for more than your target cycle time.
- Monthly: Review cycle time trends, rejection rates, and approver response times. Identify any workflows that are trending in the wrong direction.
- Quarterly: Conduct a full governance health review. Compare current metrics against your targets. Adjust workflows, reassign approvers, or update submission guidance based on what the data shows.
Common Problems and What the Data Tells You
Problem: Cycle Times Are Increasing
Possible causes:
- Approver workload has grown without adding capacity
- Content complexity has increased but workflow steps have not been adjusted
- A key approver left or changed roles and their replacement is slower to respond
What to do: Check per-step response times to identify the constraint. If one approver is the bottleneck, add a parallel approver to that step or redistribute their workflow assignments. If the content itself is more complex, consider adding a pre-review checklist to catch common issues before formal submission.
Problem: High Rejection Rate
Possible causes:
- Approval criteria are not documented or are ambiguous
- Authors are submitting incomplete content to “get it in the queue”
- Different approvers apply different standards
What to do: Document explicit approval criteria for each workflow and share them with content authors. Standardize what “ready for review” means. If approver standards vary, run a calibration session where approvers review the same content and discuss their decisions.
Problem: Pages Stuck in Queue
Possible causes:
- Approvers do not know items are waiting (notification fatigue or misconfigured alerts)
- The workflow requires approvers who are frequently unavailable
- Pages are submitted to the wrong workflow
What to do: Verify that approval notifications are reaching the right people. Consider adding escalation rules — if a page has been in review for more than N days, notify the space admin or a backup approver. Review whether your workflow routing matches how content is actually created.
Problem: Teams Bypassing the Workflow
Possible causes:
- The approval process takes too long relative to the urgency of the content
- Authors do not see value in the review step
- The workflow creates friction without visible benefit
What to do: This is the most serious signal because it means governance is failing silently. Look at the data: if cycle times are reasonable but teams still bypass, the problem is cultural — you need stakeholder buy-in. If cycle times are genuinely too long, fix the bottleneck before enforcing compliance.
Setting Targets
Every organization is different, but here are reasonable starting points for approval health targets:
| Metric | Target Range | Red Flag |
|---|---|---|
| Approval cycle time | 1-5 business days | > 10 business days |
| Queue depth trend | Stable or declining | Growing for 3+ consecutive weeks |
| Rejection rate | 10-25% | > 40% |
| Resubmission success rate | > 80% | < 60% |
| Workflow completion rate | > 90% | < 75% |
Cycle time 1-5 days, stable queue, rejection rate 10-25%, completion > 90%
Cycle time trending up, queue growing 2+ weeks, rejection rate 25-40%
Cycle time > 10 days, queue growing 3+ weeks, rejection > 40%, teams bypassing
Adjust these based on your content types and regulatory requirements. A pharmaceutical SOP might have a longer acceptable cycle time than an internal engineering doc, and that is fine — the key is that you have defined what “normal” looks like and you are watching for deviations.
From Metrics to Action
Tracking approval health is not a reporting exercise. It is an operational practice. The point is not to produce dashboards — it is to catch problems before they become crises.
The most effective governance teams treat analytics the way engineering teams treat monitoring: they set up alerts for anomalies, review trends regularly, and make targeted changes when the data warrants it. They do not wait for a compliance audit to discover that their approval process broke down three months ago.
Start with cycle time and queue depth. Those two metrics alone will tell you whether your process is healthy. Add rejection rates and approver response times when you are ready to optimize. Export and review quarterly at minimum.
If you are not currently tracking any of this, the first step is to set up ApprovalFlow and run your workflows through it for 30 days. After a month of data, you will have a baseline. From there, you can set targets, identify bottlenecks, and continuously improve.
Related Resources
- Confluence Content Governance Checklist for Compliance Teams — a practical checklist covering the full governance framework, including approval workflows, audit trails, and access policies
- Content Governance in Confluence: Moving Beyond Page Restrictions — why native Confluence permissions are not enough for regulated content
- ApprovalFlow Product Documentation — setup guides, workflow configuration, and feature reference
FAQ
How do you track approval workflow performance in Confluence?
Confluence does not include built-in approval analytics or workflow performance tracking. The platform tracks page versions and edit history, but it does not provide metrics on approval cycle times, queue depths, or reviewer response times.
Teams using ApprovalFlow for Confluence can track workflow performance through the Workflow Analytics dashboard, which shows submission counts, approval rates, status distribution, and per-workflow breakdowns with configurable date range filtering. For deeper analysis, approval history can be exported as CSV or HTML.
What metrics should you monitor for Confluence approval workflows?
The five key metrics are:
- Approval cycle time — how long pages wait from submission to final decision
- Queue depth — how many pages are pending review at any given time
- Rejection and resubmission rate — how often content is sent back before approval
- Approver response time — how quickly individual reviewers act on assigned items
- Workflow completion rate — what percentage of submissions reach a final approved state
Together, these metrics reveal whether your governance process is functioning efficiently or deteriorating.
What causes approval bottlenecks in Confluence?
The most common causes are:
- Overloaded approvers assigned to too many workflows or steps, creating a single point of delay
- Sequential approval chains where one slow step blocks the entire process for every page in the queue
- Unclear approval criteria that lead to unnecessary rejections and resubmission cycles
- Notification failures where approvers do not realize items are waiting for their review
- Misrouted submissions where content is submitted to the wrong workflow and sits unattended
Identifying the root cause requires looking at per-step and per-approver analytics rather than aggregate workflow metrics.
Can you export approval analytics from Confluence?
With ApprovalFlow, yes. The Workflow Analytics dashboard supports exporting approval history as CSV for spreadsheet analysis or HTML for formatted reports. Exports include timestamps, actor identifiers, page version numbers, workflow step details, and decision comments.
This is particularly useful for compliance reviews where auditors need approval evidence in a portable format, for management reporting on governance program effectiveness, and for identifying long-term trends that require time-series analysis beyond what the dashboard provides.