This post is for MuleSoft platform engineers, integration architects, and technical leads who use Confluence for team documentation and want to make MuleSoft API data accessible to stakeholders who do not have Anypoint Platform access.
Most organizations run MuleSoft integrations that touch dozens of APIs across multiple environments. The data about those APIs — what is deployed, what version is running, which security policies are applied, whether environments are in sync — lives in Anypoint Platform. The problem is that Anypoint Platform access is typically limited to the platform engineering team. Everyone else who needs this information — product managers, architects, security reviewers, compliance officers, on-call engineers reading runbooks — either asks the platform team or works without it.
This is the MuleSoft API visibility gap. The data exists, but it is not visible where decisions get made.
The Visibility Problem in MuleSoft Organizations
MuleSoft Anypoint Platform (MuleSoft’s unified management console for APIs and integrations) is a powerful tool for the teams that use it daily. But it was designed for platform engineers, not for the broader organization. Access is typically restricted to people who need to deploy, configure, or manage APIs directly.
This creates a structural information asymmetry. The people who build and operate MuleSoft integrations can see everything. Everyone else sees nothing — unless someone manually copies the information into a Confluence page, a Slack message, or a slide deck.
Who needs API visibility but lacks Anypoint access
Product managers planning feature releases need to know which APIs are deployed in production, what versions are running, and whether dependent services are stable. They should not need to request a platform engineer’s time for this.
Security and compliance teams reviewing API security posture need to see what policies are applied, whether authentication is enforced, and how policy coverage varies across environments. Manually requesting this data for every review cycle creates bottlenecks and delays.
Architects evaluating the integration landscape need a current inventory of APIs, their versions, deployment states, and environment distribution. Architecture decisions based on stale information lead to misaligned roadmaps.
On-call engineers responding to incidents need to see deployment status and configuration for affected services quickly. If the runbook references a service and the engineer cannot verify its current state without logging into Anypoint, incident resolution slows down.
New team members onboarding onto a project need to understand the integration topology. Telling them to “check Anypoint” assumes they have access, training, and context they do not yet have.
In each of these cases, the information already exists in Anypoint Platform. The problem is getting it to the people who need it, in the place where they already work.
Need deployment status and version info for release planning
Need policy coverage and security posture across environments
Need live deployment state in runbooks during incident response
Confluence as the Visibility Layer
For most organizations using Atlassian tools, Confluence is the natural place to surface MuleSoft API data. Teams already use Confluence for runbooks, architecture documentation, project status pages, and compliance evidence. Adding live API visibility to those same pages eliminates the context switch between “where I read about the integration” and “where I check if the integration is healthy.”
MuleSight for Confluence bridges this gap. It is a Forge-native Confluence Cloud app that connects to your MuleSoft Anypoint Platform via a read-only Connected App and makes API data visible directly on Confluence pages. MuleSight never modifies anything in MuleSoft — every API call is a GET request.
The result is that anyone with Confluence access can see live MuleSoft API status, environment comparisons, and security posture without needing their own Anypoint login.
How MuleSight Brings API Data into Confluence
MuleSight provides several mechanisms for surfacing MuleSoft data in Confluence, each suited to different visibility needs.
Snapshot Macros for Inline API Visibility
The most direct form of visibility is the snapshot macro. When you paste an Anypoint Platform URL into a Confluence page — an Exchange asset URL, a Runtime Manager application URL, or an API Manager instance URL — MuleSight converts it into a live data card.
These cards display current information pulled from MuleSoft APIs:
- Exchange macros show asset name, type, version, lifecycle state, and publish metadata
- Runtime Manager macros show application name, deployment status, artifact version, target environment, and worker configuration
- API Manager macros show API instance name, version, status, applied policies, SLA tiers, and contract counts
Three display modes let you choose the right level of detail for the page context. Detailed mode renders a full card with all metadata — suitable for runbooks and design documents. Compact mode renders a condensed row for status dashboards where you need to show many resources at a glance. Endpoints mode (for Exchange assets) renders the HTTP methods, resource paths, and descriptions extracted from RAML or OAS specifications.
Each macro includes a direct link to the resource in the Anypoint console, so a platform engineer who sees something worth investigating can jump straight to the source system. If MuleSoft APIs are temporarily unreachable, MuleSight renders the last cached snapshot with a stale data warning — so the Confluence page never goes blank.
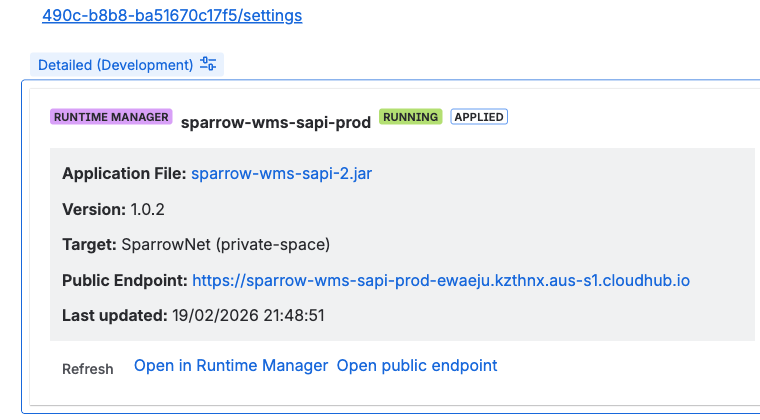
MuleSight snapshot macros in Confluence. Detailed mode shows full metadata for runbooks; compact mode renders condensed rows for status dashboards.
Environment Comparison for Cross-Environment Visibility
Individual snapshot macros show the state of a single resource. But many visibility questions are comparative: “Is the same version deployed in staging and production?” or “Which APIs are deployed in dev but not yet in prod?”
The MuleSight Environment Comparison Dashboard answers these questions. It lets you select multiple MuleSoft environments and compare resources side by side. For API Manager, it shows each logical API with per-environment columns displaying version, instance ID, and status. For CloudHub, it shows deployment status, artifact version, and application name per environment.
MuleSight flags drift — differences in presence, version, or status across environments. A “Drift only” toggle filters the view to show only misaligned resources, which is the fastest way for anyone (not just platform engineers) to understand where environments diverge.
The dashboard supports CSV and HTML export (up to 10,000 rows) for sharing with stakeholders outside Confluence or attaching to change management workflows.
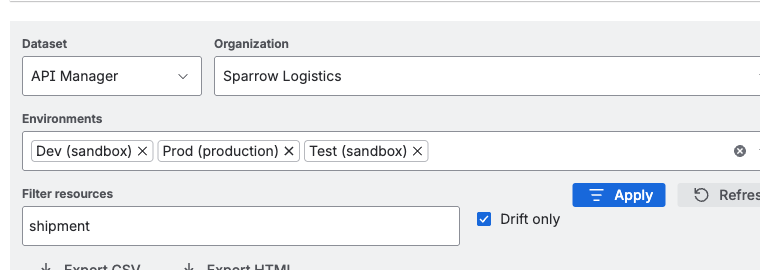
The Environment Comparison dashboard compares resources across selected environments. The “Drift only” toggle filters to show only misaligned resources.
Security Posture Visibility
API security is one area where the visibility gap creates real risk. If security and compliance teams cannot see which policies are applied to which APIs across which environments, they are assessing security posture based on assumptions rather than data.
The MuleSight Security Posture tab surfaces per-API, per-environment security data directly in Confluence:
- Applied policies with category tags (AUTH, THREAT, ALLOWLIST, TRAFFIC, CUSTOM)
- SLA tier definitions with rate limits and auto-approve configuration
- Contract counts for informational context
Security drift detection compares enabled policy templates across environments, intentionally ignoring disabled policies and version-only differences to reduce false positives. The focus is on meaningful security gaps — like an authentication policy present in production but absent in staging.
A drilldown modal lets reviewers inspect full policy, tier, and contract details for any API instance. Results can be exported as CSV or HTML for audit evidence.
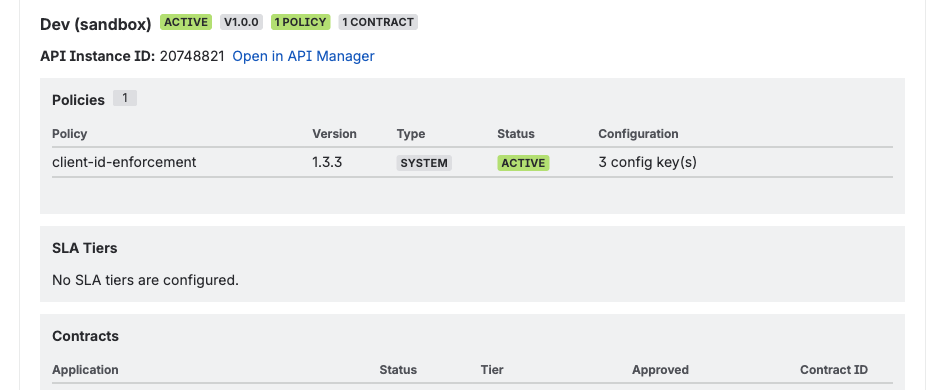
API Security Posture drill-down showing applied policies, SLA tiers, and contracts for a specific API across environments.
Scheduled Drift Notifications
Visibility is most valuable when it is proactive. The MuleSight Ops Dashboard runs on a configurable schedule and monitors for drift transitions — resources that were aligned and have become misaligned, or vice versa.
When drift is detected, MuleSight publishes a structured incident page under a designated parent page in your Confluence space. Each incident page includes run summaries, change categories (new resources, version changes, status changes, newly drifted items), drift snapshot tables, and deep links to affected Anypoint resources.
Every published incident page @mentions your configured MuleSight Incident Watchers — Confluence users who receive notifications through their existing channels (email, Slack, mobile push). This means stakeholders do not need to remember to check the dashboard. When something changes, Confluence tells them.
AI-Assisted Inventory Queries
For teams using Atlassian Rovo, MuleSight includes a Specialist Rovo Agent that answers natural language questions about your MuleSoft inventory using cached data. Questions like “Show me all CloudHub apps in production that are currently STOPPED” or “What policies does the Payment Gateway API have in DEV?” return structured answers with snapshot timestamps.
The agent uses non-hallucination guardrails: if it does not have data to answer a question, it says so and recommends refreshing or checking the dashboard directly.
What Changes When API Data Is Visible
When MuleSoft API visibility moves from Anypoint Platform into Confluence, several organizational patterns shift:
Self-service replaces request queues. Product managers stop filing tickets asking “what version is deployed in prod?” The answer is on the Confluence page they already use for project tracking.
Security reviews get faster. Compliance teams can see current policy coverage across environments on a Confluence page instead of scheduling a walkthrough with the platform team. Audit evidence is exportable, timestamped, and always current.
Incident response starts with context. On-call engineers open the runbook and see live deployment status alongside the troubleshooting steps. They do not need to context-switch to Anypoint to verify basic facts before they can start debugging.
Architecture decisions use current data. Integration landscape reviews reference live dashboards instead of manually maintained spreadsheets. The environment comparison shows what is actually deployed, not what someone remembered to update last quarter.
Onboarding accelerates. New team members read Confluence pages that show the current state of the integration platform. Their mental model starts accurate because the documentation is not a historical snapshot — it reflects what is running right now.
Diagnostics: Understanding What MuleSight Can See
Before MuleSight can provide visibility, it needs the right permissions from your MuleSoft Connected App. The Diagnostics tab provides probe-driven validation that shows:
- Coverage status (full, partial, none) per dataset
- Forbidden endpoints where the Connected App lacks required scopes
- Timeout endpoints indicating network or availability issues
- Required scopes with per-scope status and impact explanations
If diagnostics show partial coverage, MuleSight explains exactly which features are unavailable and which scopes to add. This prevents the common problem of configuring an integration, assuming it has full visibility, and later discovering blind spots.
Getting Started
MuleSight is available on the Atlassian Marketplace. Setup requires a MuleSoft Connected App with eight read-only OAuth scopes — no write access needed.
- Install MuleSight from the Atlassian Marketplace
- Configure your Connected App credentials in Confluence space settings
- Run a test connection to validate access
- Paste Anypoint URLs into Confluence pages to create live snapshot macros
From there, open the MuleSight dashboard to compare environments, configure watchers in the Ops tab for drift notifications, and use the Security Posture tab for governance reviews.
FAQ
What does MuleSoft API visibility mean in the context of Confluence?
MuleSoft API visibility in Confluence means that API status, deployment details, environment health, and security posture from Anypoint Platform are surfaced directly on Confluence pages. Instead of requiring every stakeholder to log into Anypoint, MuleSight renders live data cards and dashboards inside the wiki where teams already collaborate. This eliminates the information asymmetry between platform engineers who have Anypoint access and the broader organization that does not.
Do Confluence users need MuleSoft Anypoint access to see API data?
No. MuleSight uses a single Connected App credential configured by a Confluence space administrator. Anyone who can view the Confluence space can see MuleSight snapshot macros and dashboards without needing their own Anypoint Platform login. This is the core value proposition — making API data visible to people who do not have (and should not need) direct Anypoint access.
How does MuleSight improve MuleSoft documentation in Confluence?
MuleSight replaces static screenshots and manually maintained tables with live snapshot macros that pull current data from MuleSoft APIs. Exchange assets, Runtime Manager applications, and API Manager instances are displayed as structured cards that show real-time status, version, and configuration details. The documentation stays current because it references the source of truth rather than storing a static copy.
Can MuleSight show API security information in Confluence?
Yes. The API Security Posture tab shows applied policies categorized by type (AUTH, THREAT, ALLOWLIST, TRAFFIC, CUSTOM), SLA tier definitions with rate limits, and contract counts per API per environment. It compares enabled policy templates across environments and flags security drift — like an authentication policy present in production but missing in staging. Results can be exported as CSV or HTML for compliance evidence.
Is MuleSight read-only? Does it change anything in MuleSoft?
Yes, MuleSight is entirely read-only. It uses GET-only API calls against MuleSoft Anypoint Platform and never writes, deploys, restarts, or modifies MuleSoft resources. The Connected App requires only eight read-only OAuth scopes. Your Anypoint Platform remains untouched.
MuleSight is a Forge-hosted Confluence Cloud app. All data processing runs on Atlassian infrastructure with no external egress beyond anypoint.mulesoft.com. Feature descriptions in this post reflect the current product as of March 2026.