If your team runs MuleSoft integrations and documents work in Confluence, there is a visibility gap you have probably felt: the people who need to know about API health are not always the people who log into Anypoint Platform. Project managers checking deployment status. Architects reviewing environment consistency before a release. Support engineers investigating an incident. They all end up asking someone to look it up.
MuleSight closes that gap. It is a Confluence Cloud app that connects to your MuleSoft Anypoint Platform and brings API monitoring data directly into the pages your team already reads. No Anypoint credentials required for viewers. No context switching.
This post walks through how to set up MuleSight for API monitoring and the three layers of visibility it provides: on-demand snapshots, cross-environment dashboards, and automated incident detection.
What You Need Before Starting
MuleSight runs on Atlassian Forge and connects to Anypoint Platform via a Connected App. Here is what you need:
- Confluence Cloud — MuleSight is a Forge app, so it requires Confluence Cloud (not Data Center or Server)
- MuleSoft Anypoint Platform — with at least one environment configured
- A Connected App — with these read-only OAuth scopes:
- Organization, Environments, Exchange, API Configuration, API Policies, API Contracts, Applications, Runtime Fabrics
MuleSight never needs write permissions. Every API call is a GET request. It reads your MuleSoft data and caches it in Confluence — nothing more.
Layer 1: Snapshot Macros — Paste a URL, Get a Live Card
The fastest way to start monitoring is with snapshot macros. Paste an Anypoint Platform URL directly into a Confluence page, and MuleSight auto-converts it into a live data card.
Three types of snapshots are available:
API Manager Snapshots
Paste an API Manager instance URL and MuleSight renders a card showing the API name, version, status (ACTIVE, INACTIVE, or DEPRECATED), and the API Instance ID with a deep link back to the Anypoint console.
Switch to Security display mode to see applied security policies with their categories (AUTH, THREAT, ALLOWLIST, TRAFFIC, CUSTOM), SLA tier definitions, and active contracts with consumer details.
CloudHub Application Snapshots
Paste a Runtime Manager application URL and the card shows the application name, artifact version, deployment status (RUNNING, STOPPED, or NOT_DEPLOYED), deployment name, and public endpoint when available.
Exchange Asset Snapshots
Paste an Exchange asset URL to see the asset name, type, version, lifecycle state, and last-updated timestamp. Switch to Endpoints display mode to see HTTP methods, resource paths, and descriptions extracted from the RAML or OAS specification.
Every snapshot shows a timestamp indicating when the data was last fetched. If MuleSight cannot reach Anypoint during a refresh, it renders the last cached snapshot with a stale-data warning — pages never go blank.
Where Snapshots Fit in Monitoring
Use snapshots to build a macro coverage page — a single Confluence page that embeds the APIs and applications your team cares about most. This becomes a lightweight monitoring dashboard that anyone on the team can check without asking for access.
For example, a “Production API Health” page might embed snapshot macros for your five most critical API Manager instances and three key CloudHub applications. Anyone on the team opens that page and sees current status at a glance.
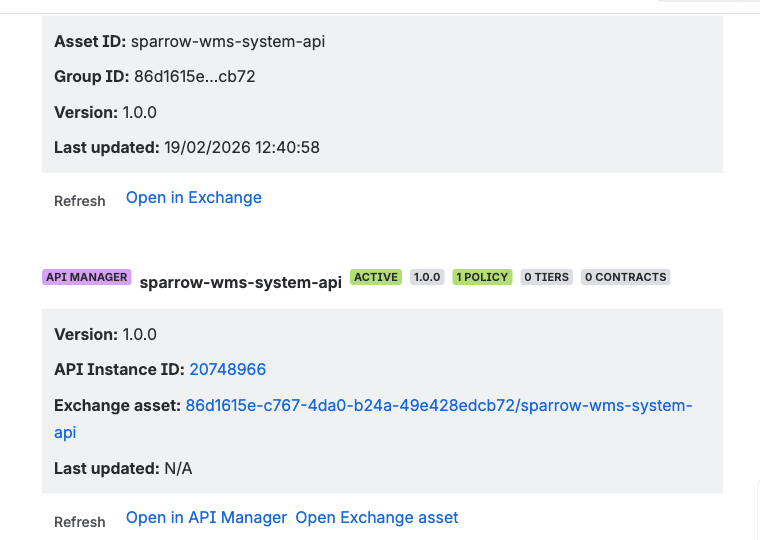
MuleSight snapshot macros embedded in a Confluence page. API Manager and Exchange assets render as live data cards with current status, version, and metadata.
Layer 2: Environment Comparison Dashboard — Spot Drift Instantly
Snapshots show you individual resources. The Environment Comparison dashboard shows you what is different between environments.
Select two or more MuleSoft environments (dev, staging, production) and MuleSight compares all resources side by side. For API Manager, it shows each logical API keyed by groupId and assetId with per-environment columns for version, Instance ID, and status. For CloudHub, it shows application artifacts with deployment status and artifact version per environment.
MuleSight flags three types of drift:
- Presence drift — a resource exists in one environment but not another
- Version drift — different artifact versions across environments
- Status drift — RUNNING vs STOPPED, or ACTIVE vs INACTIVE
Toggle “Drift only” to filter the table down to misaligned resources. This answers the question every team asks before a release: “What is different between staging and production right now?”
Every row links directly to the relevant Anypoint console page, so investigating a drift finding is one click away.
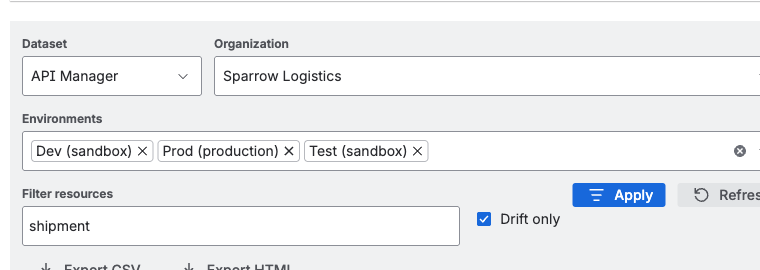
The Environment Comparison dashboard — select environments and instantly see which resources are drifted. Toggle “Drift only” to focus on misaligned items.
API Security Posture Dashboard
A separate dashboard tab compares security policies, SLA tiers, and contracts across environments. This catches a common problem: a policy that is enabled in production but missing from staging, or an SLA tier that was updated in one environment but not propagated.
Security drift detection intentionally ignores disabled policies to reduce noise. It compares only enabled policies by template identity, so you see meaningful differences rather than configuration artifacts.
You can export dashboard data as CSV or HTML (up to 10,000 rows) for compliance reporting or offline review.
Layer 3: Scheduled Drift Detection — Automated Incident Pages
Manual dashboard checks are useful, but they require someone to remember to look. The MuleSight Ops Dashboard automates this.
Once configured, MuleSight runs drift detection on a schedule (configurable per space, minimum interval: 1 hour). When drift changes state — aligned environments become drifted, or drifted environments return to alignment — MuleSight publishes a structured child page under a “MuleSight Ops Dashboard” parent page in your Confluence space.
Each published incident page includes:
- A run summary table showing what changed
- The specific resources that drifted or realigned
- @mentions of configured MuleSight Incident Watchers
Watchers receive Confluence notifications through their existing channels: email, Slack integration, or mobile push. This means your team gets notified about MuleSoft drift through the same system they already use for Confluence updates — no separate alerting tool required.
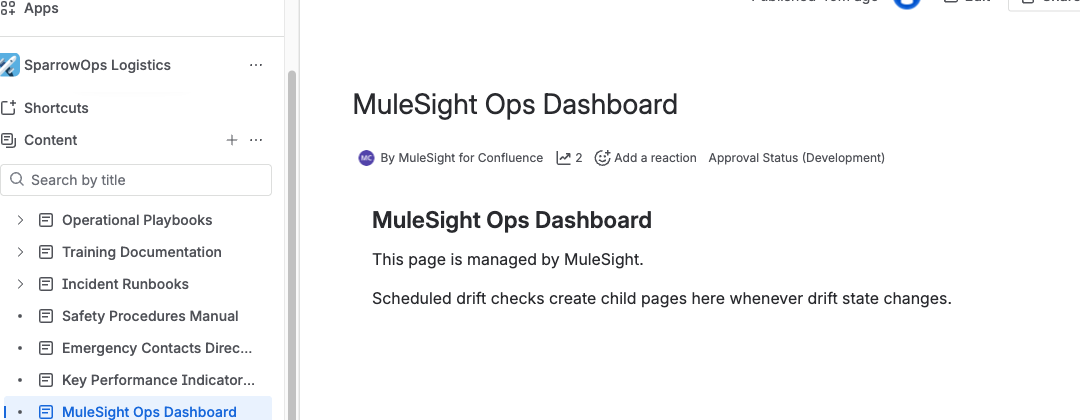
Automated incident pages published by the MuleSight Ops Dashboard. Each page contains drift summaries and @mentions watchers through Confluence’s notification system.
Why This Matters for Operations
Traditional MuleSoft monitoring tools send alerts when individual resources fail. MuleSight detects a different class of problem: environment inconsistency. An API that is ACTIVE in staging but INACTIVE in production is not a “failure” in the traditional sense, but it is a deployment gap that causes real incidents.
By publishing drift transitions as Confluence pages, MuleSight creates an audit trail of environment changes over time. Teams can look back and see when environments diverged and when they were brought back into alignment.
Bonus: AI-Assisted Queries with Rovo
If your Confluence instance has Rovo enabled, MuleSight includes a Specialist agent that can answer natural-language questions about your MuleSoft inventory. Ask questions like “Which APIs are deployed to production?” or “What policies are applied to the Order API?” and get answers drawn from cached snapshot data.
The Rovo agent uses cached data by default to avoid unnecessary API calls. It always reports the snapshot timestamp in its answers so you know how fresh the data is. If you need current data, you can confirm a live refresh before the agent answers.
The agent is space-scoped — it only accesses data for the Confluence space you are working in — and it returns “no data” rather than guessing when information is not available.
Setting Up MuleSight for Monitoring
Here is the setup path:
- Install MuleSight from the Atlassian Marketplace
- Create a Connected App in Anypoint Platform with the 8 read-only OAuth scopes listed above
- Configure MuleSight in your Confluence space settings — enter your Connected App credentials and select your Anypoint organization
- Set a sync interval — how often MuleSight should refresh cached data (1 to 24+ hours)
- Configure Incident Watchers — team members who should be @mentioned when drift is detected
- Start embedding — paste Anypoint URLs into pages or open the MuleSight Dashboard from the space apps menu
Each Confluence space has independent configuration, so different teams can connect to different Anypoint organizations or set different sync intervals based on their needs.
When to Use Each Monitoring Layer
| Layer | Best for | Frequency |
|---|---|---|
| Snapshot macros | Monitoring specific critical APIs/apps on a dedicated page | On-demand (manual page refresh) |
| Environment Comparison dashboard | Pre-release checks, architecture reviews, incident investigation | On-demand (when you need to compare) |
| Ops Dashboard (scheduled) | Continuous drift detection across all environments | Automatic (hourly or configured interval) |
| Rovo agent | Ad-hoc questions about inventory and status | On-demand (conversational) |
Most teams start with snapshot macros on a few key pages, graduate to the Environment Comparison dashboard for release processes, and then enable the Ops Dashboard for continuous automated monitoring.
What MuleSight Does Not Do
Setting clear expectations matters. MuleSight is not a replacement for traditional AM (Application Monitoring) or log aggregation tools. It does not:
- Monitor request latency or throughput
- Collect or display application logs
- Send direct email or SMS alerts
- Modify, deploy, or restart MuleSoft resources
MuleSight monitors environment state: what is deployed, where, in what version, and with what configuration. It answers “is our MuleSoft landscape consistent?” rather than “is this specific API call slow?”
For teams that already use tools like Splunk, Datadog, or MuleSoft’s own monitoring for runtime metrics, MuleSight adds a complementary layer: structural monitoring that catches deployment gaps, version mismatches, and policy inconsistencies.
Get Started
MuleSight is available on the Atlassian Marketplace. Installation takes a few minutes, and the read-only Connected App setup is straightforward.
For detailed setup instructions, see the MuleSight documentation.
If your team manages MuleSoft integrations and relies on Confluence for documentation, MuleSight turns your wiki into a monitoring surface — so API health is visible to everyone who needs it, not just the people with Anypoint logins.
Related posts: