
If you manage MuleSoft integrations and use Confluence for team documentation, you have probably experienced the gap between what is happening in Anypoint Platform and what your team actually sees. A CloudHub app stops in production. An API version drifts between staging and prod. A security policy exists in one environment but not another. These problems are often invisible until something breaks downstream.
MuleSight is a Confluence Cloud app that bridges this gap. It brings MuleSoft Anypoint visibility directly into Confluence pages, dashboards, and even AI chat — so integration failures surface where your team already works, before they escalate into incidents.
What MuleSight Actually Does
MuleSight connects to your MuleSoft Anypoint Platform via a read-only Connected App and pulls environment data into Confluence. It does not modify anything in MuleSoft — every API call is a GET request. What it does is make that data visible, comparable, and actionable inside Confluence.
The core capabilities fall into five areas:
- Environment comparison with drift detection
- Scheduled incident page publishing
- Link-to-snapshot macros
- API security posture visibility
- AI-assisted inventory queries via Rovo
Each of these surfaces integration problems in a different way and at a different point in the failure timeline.
Environment Comparison: Catching Drift Before It Becomes an Outage
The Environment Comparison dashboard is where most teams start. It lets you select multiple MuleSoft environments (dev, staging, production) and compare resources side by side.
For API Manager, the dashboard shows each logical API (keyed by groupId/assetId) with per-environment columns displaying version, API Instance ID, and status. For CloudHub, it shows application artifacts with per-environment deployment status (RUNNING, STOPPED, NOT_DEPLOYED), artifact version, and deployment name.
MuleSight defines drift as any difference in:
- Presence — deployed in one environment but not another
- Version — different artifact versions across environments
- Status — RUNNING vs STOPPED, ACTIVE vs INACTIVE
The “Drift only” toggle filters the table to show only misaligned resources. This is the fastest way to answer the question: “What is different between staging and production right now?”
Every row links directly to the relevant Anypoint console page, so you can go from seeing the drift to investigating it in one click.
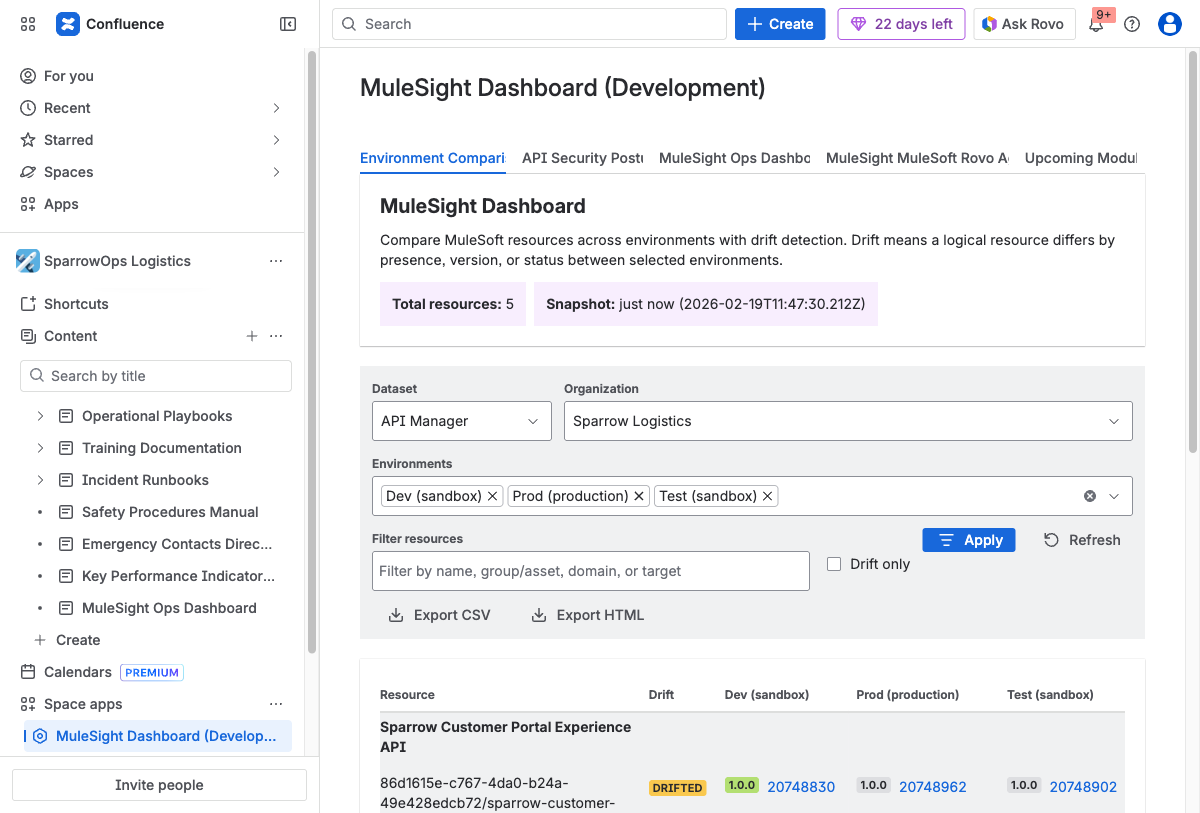
The Environment Comparison dashboard comparing API Manager resources across three environments. The DRIFTED label flags the Sparrow Customer Portal Experience API where configuration differs between environments. Use the “Drift only” toggle to filter to just misaligned resources, and export findings as CSV or HTML for stakeholders.
You can also export the comparison as CSV or HTML (up to 10,000 rows) for sharing with stakeholders who do not have Confluence access or for attaching to change management tickets.
Scheduled Incident Pages: Drift That Notifies Your Team
Seeing drift in a dashboard is useful when someone is looking. But integration failures often happen between check-ins. MuleSight addresses this with its Ops Dashboard, which runs on a configurable schedule (hourly checks, gated by your space’s sync interval).
When MuleSight detects a drift transition — resources that were aligned are now drifted, or vice versa — it publishes a structured Confluence page under a “MuleSight Ops Dashboard” parent page in your space.
Each incident page includes:
- A run summary table with the current drift state
- Dataset summary (API Manager and CloudHub)
- Change categories: new resources, removed resources, deployment changes, version changes, status changes, newly drifted items, and newly aligned items
- Current drift snapshot tables per dataset
- Status lozenges for visual scanning
- Deep links to the affected Anypoint resources
Critically, every published incident page @mentions your configured MuleSight Incident Watchers. These are Confluence users you designate in the Ops Dashboard settings. When they are mentioned, they receive Confluence notifications through their normal notification channels — email, Slack, mobile push, or whatever they have configured.
This means your team does not need to remember to check the dashboard. When drift happens, Confluence tells them.
When drift resolves (resources re-align), MuleSight publishes a separate resolution page, closing the loop.
Link-to-Snapshot Macros: Visibility Where Content Lives
Not every integration concern requires a dashboard. Sometimes you just need to see the current state of a specific API or application in the context of a Confluence page — a runbook, a deployment guide, or a project status page.
MuleSight auto-converts pasted Anypoint URLs into live snapshot cards. Paste a link to an Exchange asset, a Runtime Manager application, or an API Manager instance, and it becomes a macro showing current status, version, and metadata.
Three display modes are available:
- Detailed — full card with all metadata (status, version, timestamps, deployment info)
- Compact — inline row for embedding in tables or lists
- Endpoints — for Exchange assets, renders a table of HTTP methods, resource paths, and descriptions extracted from RAML/OAS specs
Each macro includes an action link to open the resource directly in the Anypoint console. If MuleSight cannot reach MuleSoft (network issue, credential problem), it renders the last cached snapshot with a stale data warning — so the page never goes blank.
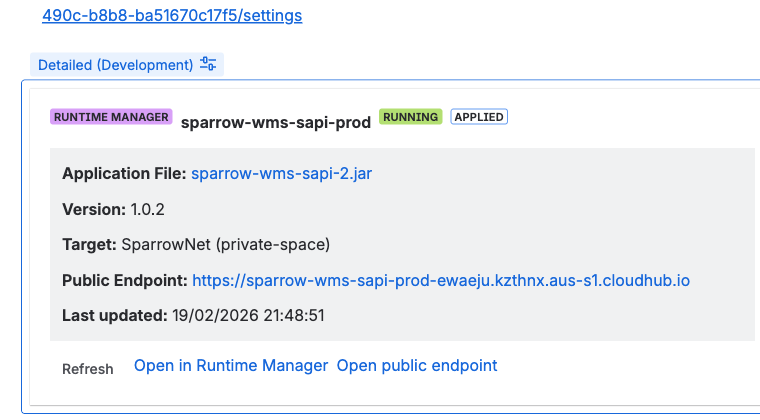
A Runtime Manager snapshot macro in Detailed mode. The card renders live deployment data — application status, artifact version, target environment, public endpoint, and freshness timestamp — directly in the Confluence page. Action links open the resource in Anypoint or refresh data on demand.
This cache-first approach means your documentation pages remain useful even during MuleSoft API outages.
Tip: For pages shared during incident response, use the Refresh action on snapshot macros to pull the latest state before sharing the link. MuleSight’s cache-first design means the page always loads — but a manual refresh ensures responders see the most current data when timing matters.
API Security Posture: Catching Policy Gaps Across Environments
Security misalignment is one of the more subtle integration failures. An API might have rate limiting and IP allowlisting in production but not in staging. A new API might be deployed without any authentication policy. These gaps are invisible unless someone manually compares policy configurations across environments.
The Security Posture tab on the MuleSight dashboard shows per-API, per-environment security data:
- Policies with category tags (AUTH, THREAT, ALLOWLIST, TRAFFIC, CUSTOM)
- SLA tiers with limit details and auto-approve status
- Contract counts for informational context
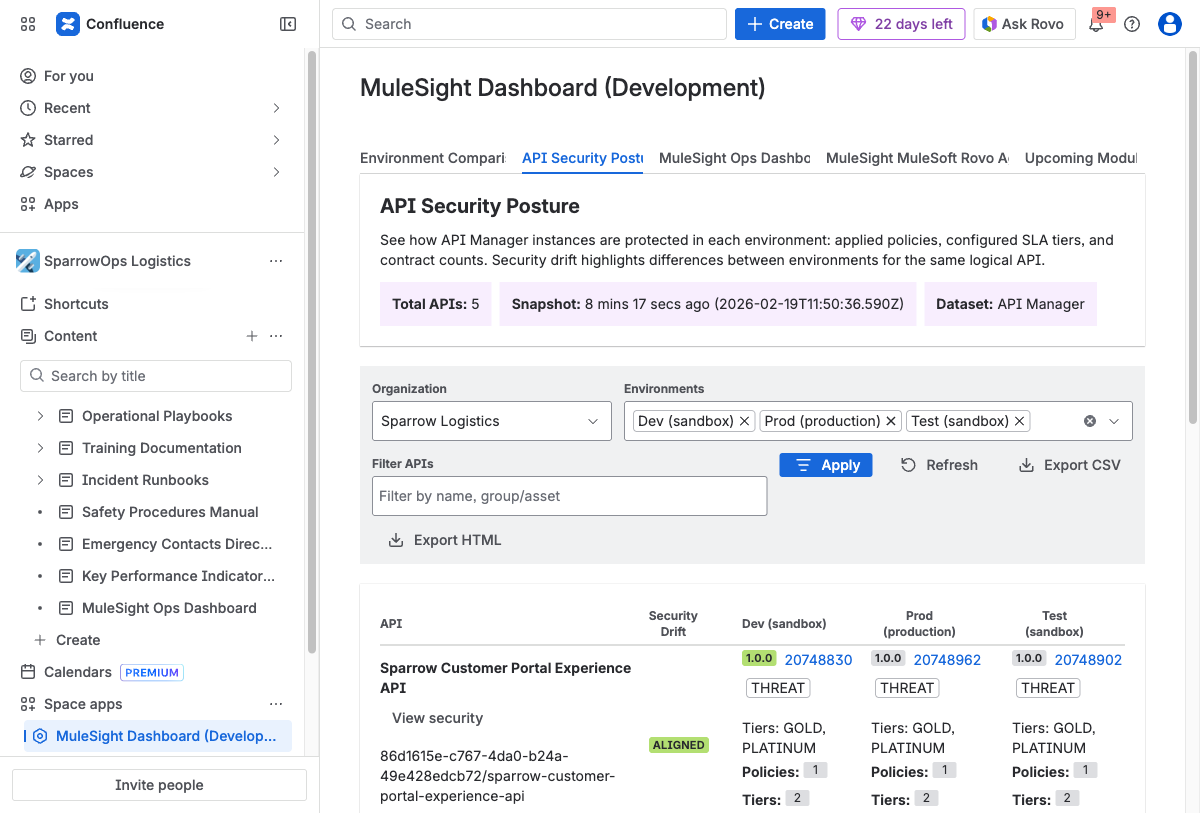
The API Security Posture tab surfaces per-API security data across environments. ALIGNED means security configuration matches everywhere. THREAT flags differences that warrant investigation — such as a policy applied in production but missing in staging, or SLA tiers that differ between environments.
Security drift detection compares enabled policies by template identity across environments. It intentionally ignores disabled policies and policy version differences to reduce false positives — the focus is on meaningful security gaps, not noisy diffs.
A drilldown modal lets you inspect the full policy, tier, and contract details for any API instance. You can search and filter to narrow focus, and export findings as CSV or HTML.
Diagnostics: Understanding What MuleSight Can See
Before MuleSight can surface failures, it needs the right permissions. The Diagnostics tab provides probe-driven validation of your Connected App’s access to MuleSoft endpoints.
It shows:
- Coverage status (full, partial, none) per dataset
- Forbidden endpoints (403 errors) — meaning your Connected App lacks specific scopes
- Timeout endpoints — indicating network or availability issues
- Required scopes with per-scope status and impact explanations
If diagnostics show partial coverage, MuleSight explains exactly what features are unavailable and which scopes to add. This prevents the common problem of configuring an integration and not realizing it has blind spots until something goes wrong.
MuleSight Specialist Rovo Agent: Ask Questions in Chat
For teams using Atlassian Rovo, MuleSight includes a chat-based AI agent that answers questions about your MuleSoft inventory using cached data.
Example questions:
- “Show me all CloudHub apps in production that are currently STOPPED”
- “What policies does the Payment Gateway API have in DEV?”
- “List APIs in staging that are INACTIVE”
The agent uses MuleSight’s cached snapshots (not live calls) by default, and always reports the snapshot timestamp so you know how fresh the data is. If you need current data, you can ask the agent to refresh — but it requires explicit confirmation before making any live API calls.
Non-hallucination guardrails are built in: if the agent does not have data to answer a question, it says so and recommends refreshing or checking the dashboard directly.
Putting It Together: The Failure Surface Timeline
MuleSight catches integration problems at multiple points:
| When | What surfaces it | How you find out |
|---|---|---|
| Someone checks the dashboard | Environment drift, security gaps | Manual review |
| Someone views a Confluence page | Stale or error status on snapshot macros | Visual indicator |
| Scheduled sync detects drift transition | New incident page published | Confluence @mention notification |
| Team member asks Rovo agent | Inventory discrepancies | Chat response |
| Admin checks diagnostics | Permission or connectivity gaps | Dashboard tab |
The result is that integration failures become visible at the point where your team can act on them — inside Confluence, through notifications they already monitor, with links that go directly to the source system.
Getting Started
MuleSight is available on the Atlassian Marketplace. It is free for up to 10 users, $1.55/user/month for teams of 251–1,000 users, and includes a 30-day free trial on all plans. Setup requires:
- A MuleSoft Connected App with read-only scopes
- Configuring the Connected App credentials in your Confluence space settings
- Running a test connection to validate access
From there, paste Anypoint links to create snapshot macros, open the dashboard to compare environments, and configure watchers in the Ops tab to start receiving drift notifications.
- Install MuleSight from the Marketplace
- Read the MuleSight documentation
- Visit flowdence.io for product details
FAQ
Does MuleSight modify anything in MuleSoft?
No. MuleSight is entirely read-only. Every MuleSoft API call is a GET request. It never writes, deploys, restarts, or modifies any MuleSoft resource. Your Anypoint Platform remains untouched.
How does MuleSight detect integration failures?
MuleSight compares deployment presence, artifact versions, and runtime status across your MuleSoft environments. When it finds differences — like an API deployed in staging but missing from production, or a CloudHub app stopped in one environment — it flags them as drift. Security drift compares enabled policy templates across environments.
Does MuleSight send email alerts?
MuleSight does not send email alerts directly. Instead, it publishes structured incident pages in Confluence and @mentions configured watchers. Those watchers receive Confluence notifications through whatever channels they have configured (email, Slack, mobile push). This uses Confluence’s existing notification infrastructure rather than building a separate alerting system.
What MuleSoft permissions does MuleSight need?
MuleSight requires a Connected App with eight read-only OAuth scopes: organization, environments, Exchange, API configuration, API policies, API contracts, applications, and Runtime Fabrics. No write scopes are needed. The Diagnostics tab validates each scope and shows exactly what is accessible.
Can I use MuleSight across multiple Confluence spaces?
Yes. MuleSight is space-scoped — each Confluence space has its own Connected App credentials, organization settings, sync interval, and watcher list. Spaces operate independently, which means different teams can connect to different MuleSoft organizations or use different sync frequencies.
Related Posts
- Detecting MuleSoft Environment Drift Using Confluence
- How to Embed Anypoint Snapshots in Confluence Pages
- Your MuleSoft Documentation Is Already Stale
MuleSight is a Forge-hosted Confluence Cloud app. All data processing runs on Atlassian infrastructure with no external egress beyond anypoint.mulesoft.com. Feature descriptions in this post reflect the current product as of March 2026.